A Data Story
Every issue takes one public dataset and turns it into an animated, interactive story you can explore.
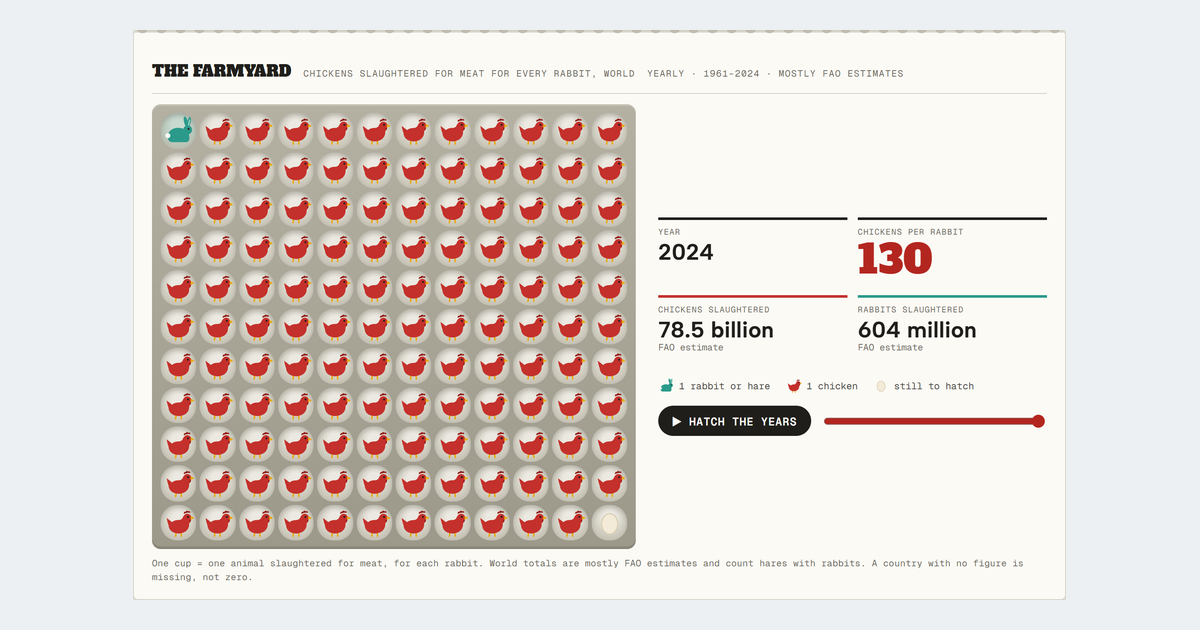
Pecking Order
In 2024 the world slaughtered 130 chickens for meat for every rabbit, up from 24 in 1961. Rabbits are famous for breeding fast, and one gives 86% of a chicken's meat. So why did the chicken win? 64 years of farm figures from the UN's Food and Agriculture Organization.
- In 2024 the world slaughtered 78.5 billion chickens and 604 million rabbits and hares for meat, by FAO estimates: 130 to 1, up from 24 to 1 in 1961.
- Per animal a rabbit gives 86% of a chicken's meat (1,402 g against 1,634 g in 2024), but a meat hen has 100 young a year to a rabbit doe's 40, FAO's 1986 rabbit handbook reports.
- Chicken meat grew 17-fold since 1961 and has out-produced pork since 2023; France produced 77% less rabbit meat in 2024 than in 1990, on official figures.
-
Small Change (Australia)
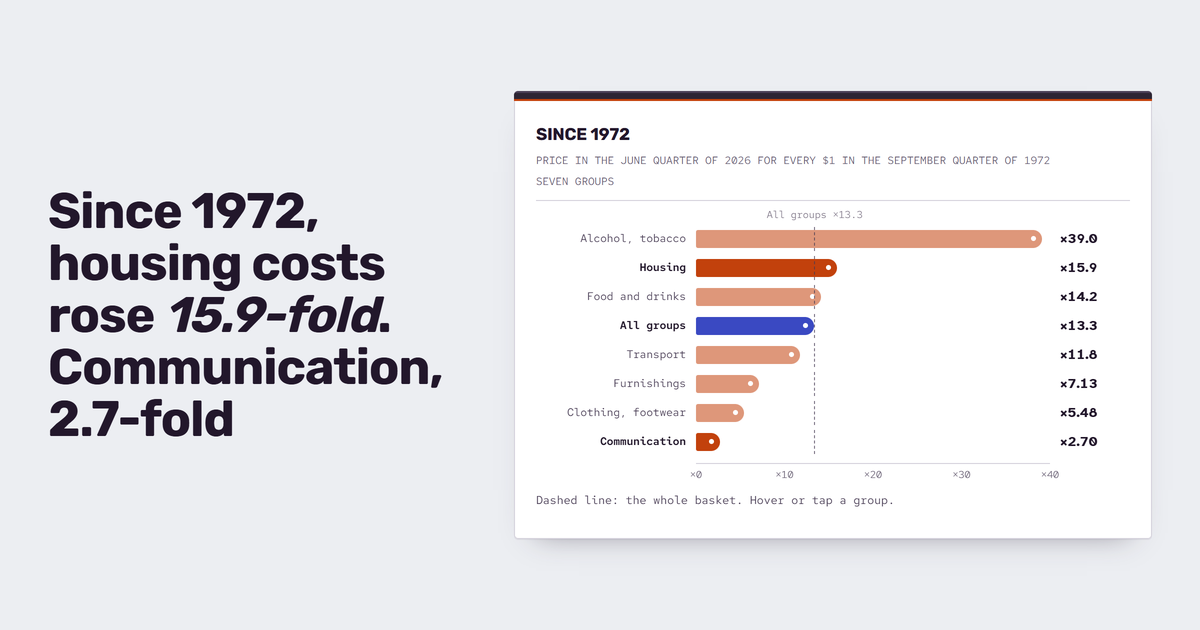
A dollar's worth of shopping in 1948 cost $39.50 in mid-2026 on Australia's consumer price index. Since 1980, a dollar's worth of TVs and computers has become 4.3 cents, while tobacco costs more than 210 times its 1972 price. Prices since 1948 in Australia's capital cities, from the ABS.
$1 of shopping in the September quarter of 1948 cost $39.50 in the June quarter of 2026 on the ABS consumer price index.
Read the story → -
Closing Ranks (UK)
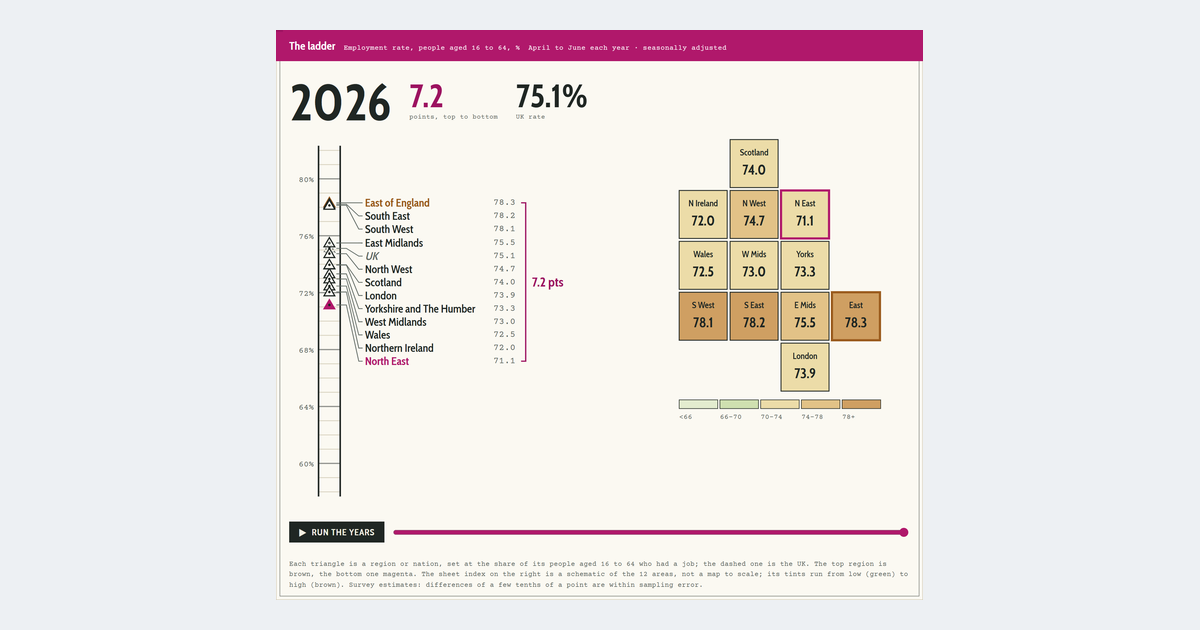
In 1992 the share of working-age people with a job was 12.0 points higher in the UK's best region than in its worst. In 2026 the gap was 7.2 points, the narrowest in 35 years by a whisker, yet the same three regions still hold the top three places. Employment in every UK region from the Office for National Statistics.
In 1992 the share of people aged 16 to 64 in work ran from 73.8% in the South East to 61.8% in Northern Ireland, a 12.0-point gap. In 2026 it ran from 78.3% to 71.1%: 7.2 points, the narrowest in 35 years, though only 0.3 points below 2023.
Read the story → -
Safe Hands
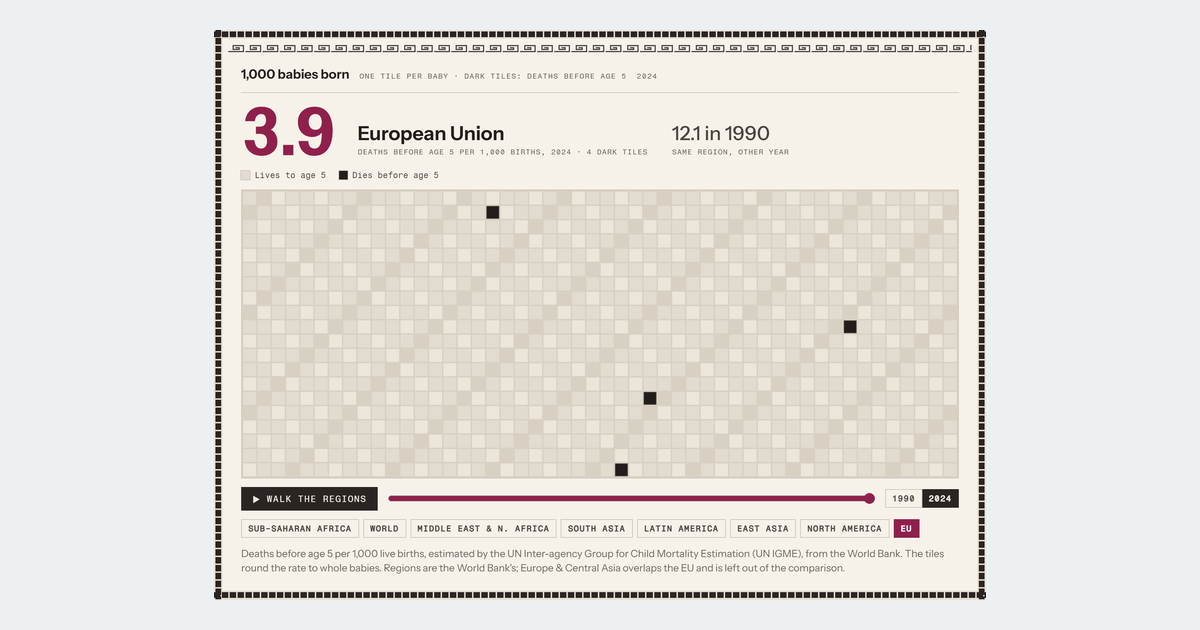
Europe isn't the richest region in the world, and its people work the fewest hours, yet the European Union is where the fewest people die young. In the EU, 3.9 of every 1,000 babies die before age five, the lowest of any world region; worldwide, 37.4. Newborns, mothers and people on the road are safest there too. In 1990 the EU was second on every one of these measures that goes back that far; by 2000 it was first. Since 2010 it has also had the lowest chance of adults dying before 70 of chronic disease. From World Bank, Penn World Table, World Happiness Report and UN Development Programme data.
In the EU, 3.9 of every 1,000 babies die before age five (2024), the lowest rate of any world region; North America's is 6.4 and the world's 37.4. In 1990 the EU was second, at 12.1.
Read the story → -
Light Years
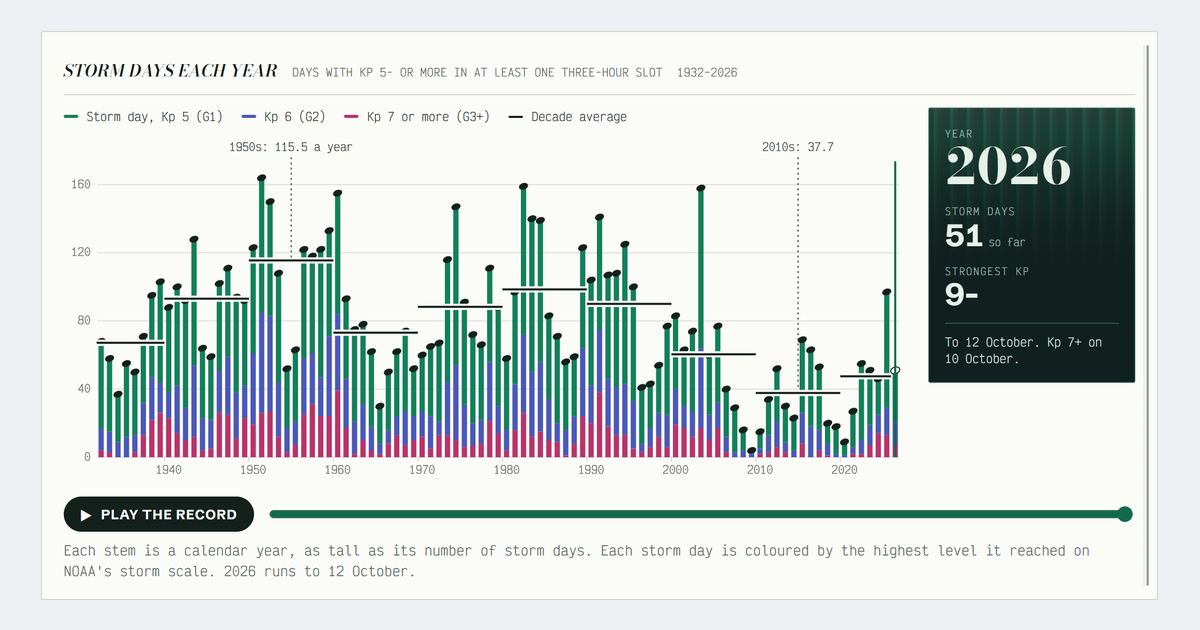
In the 1950s the Earth's magnetic field was stirred to storm level on about 116 days a year. In the 2010s it was on about 38. Every day of the Kp index since 1932: how often the magnetic field storms, in which months, and how 2026 compares.
In the 1950s geomagnetic storms came on 115.5 days a year. In the 2010s they came on 37.7, and in 2020–2025 on 47.5.
Read the story → -
Golden Years
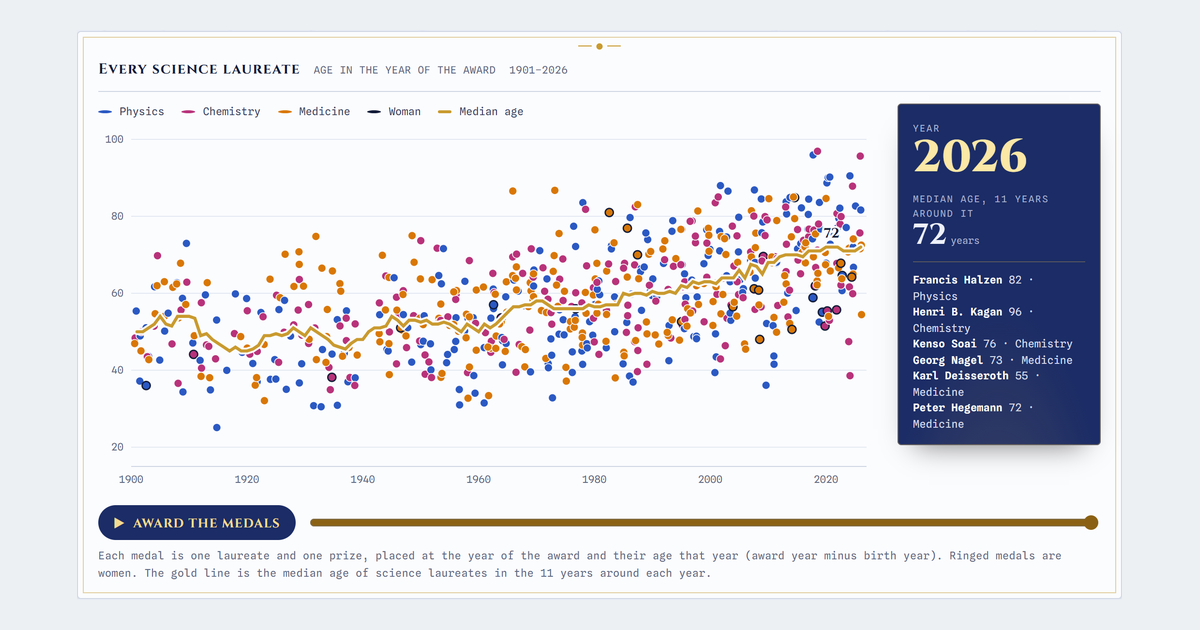
In 1901–1925 the median Nobel laureate in physics, chemistry or medicine was 49. In 2001–2026 it was 68. 126 years of who won, how old they were, where they worked and what the prize was worth, from the Nobel Prize's own data.
In 1901–1925 the median Nobel laureate in the sciences was 49 in the year they won. In 2001–2026 the median was 68.
Read the story → -
Shop Rate (US)
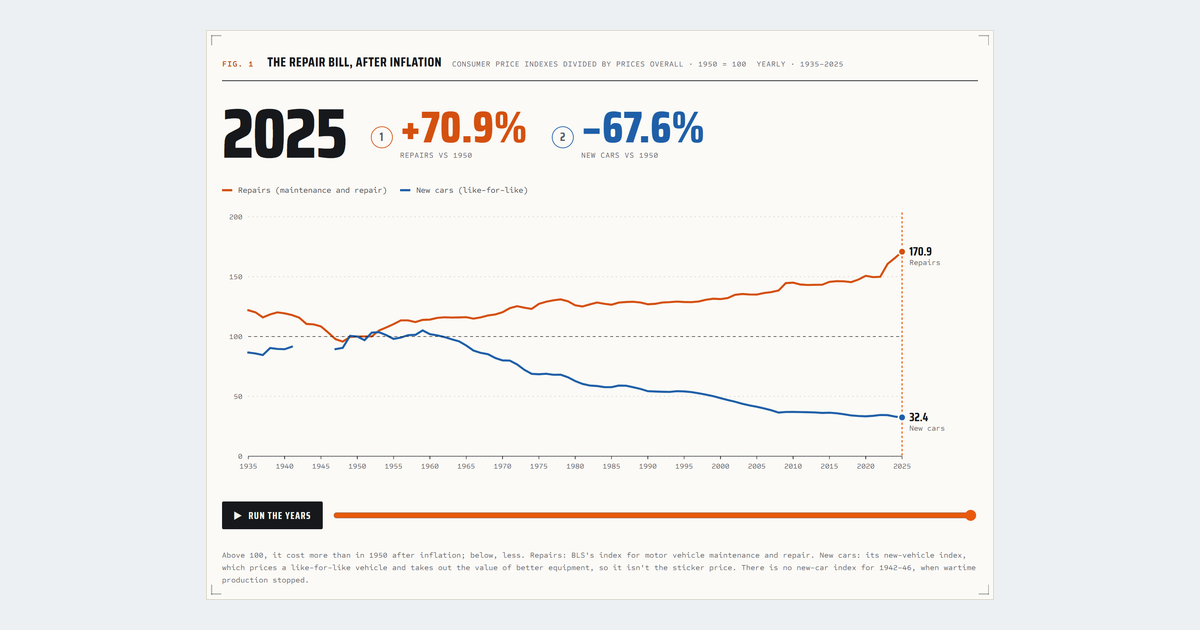
After inflation, getting a car repaired cost more in 2025 than in any year since 1935, while a like-for-like new car cost less than in any year BLS has priced it. Repairs cost 22.8 times their 1950 price, new cars 4.3 times. Ninety years of car prices from the Bureau of Labor Statistics.
After inflation, car repairs cost more in 2025 than in any year back to 1935, and a like-for-like new car less than in any year BLS has priced it.
Read the story → -
Raising the Roof (Europe)
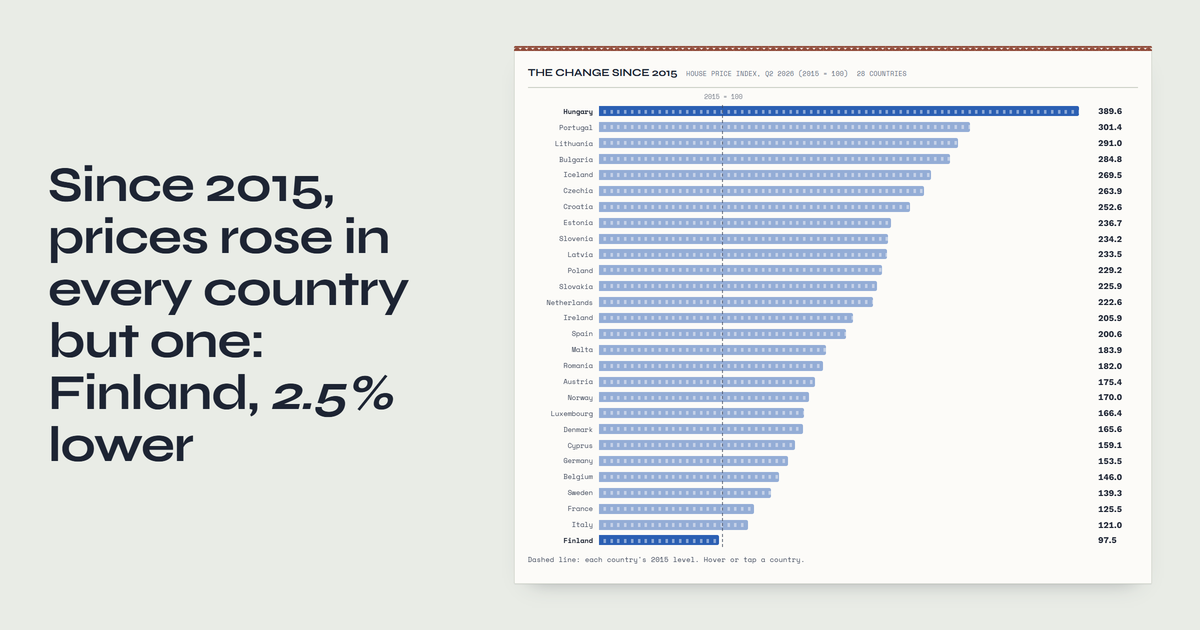
A home that cost €100,000 in early 2005 would be priced at €201,800 today on the EU's house price index; after inflation the rise is 21.4%. Twenty-one years of house prices in 28 European countries, from Eurostat.
Across the EU, house prices are 2.02 times what they were in early 2005; after inflation, they rose 21.4%.
Read the story → -
Truck Stop (US)
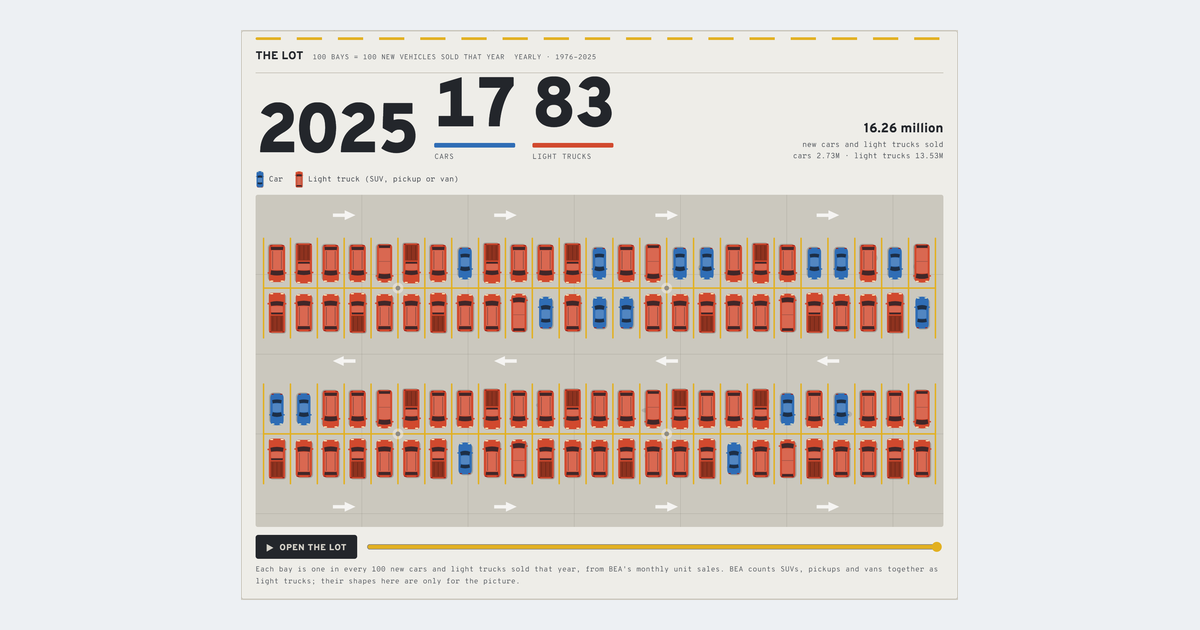
In 1976, 77 of every 100 new vehicles Americans bought were cars. In 2025, 17 were. A new car costs about 32 weeks of pay, close to the 30 it took in 1967, but the light trucks that replaced it cost 52% more.
Of every 100 new vehicles Americans bought, 77 were cars in 1976 and 17 in 2025, the fewest cars (2.73 million) of any year back to 1967.
Read the story → -
Fuel Gauge (EU)
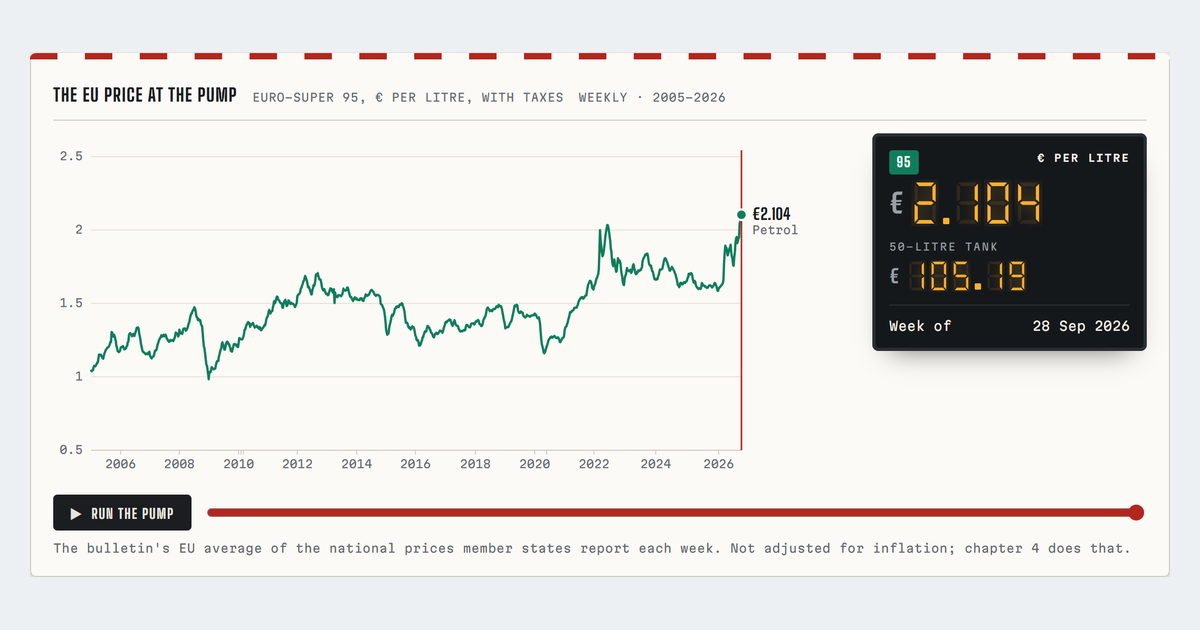
A litre of petrol costs the average EU driver a record €2.10, twice the €1.04 of January 2005. After inflation, 2012 was dearer. Twenty-one years of pump prices in 27 countries, from the EU's Weekly Oil Bulletin.
A litre of petrol in the EU cost a record €2.10 on 28 September 2026, past the €2.03 peak of June 2022.
Read the story → -
Guest Book (EU)
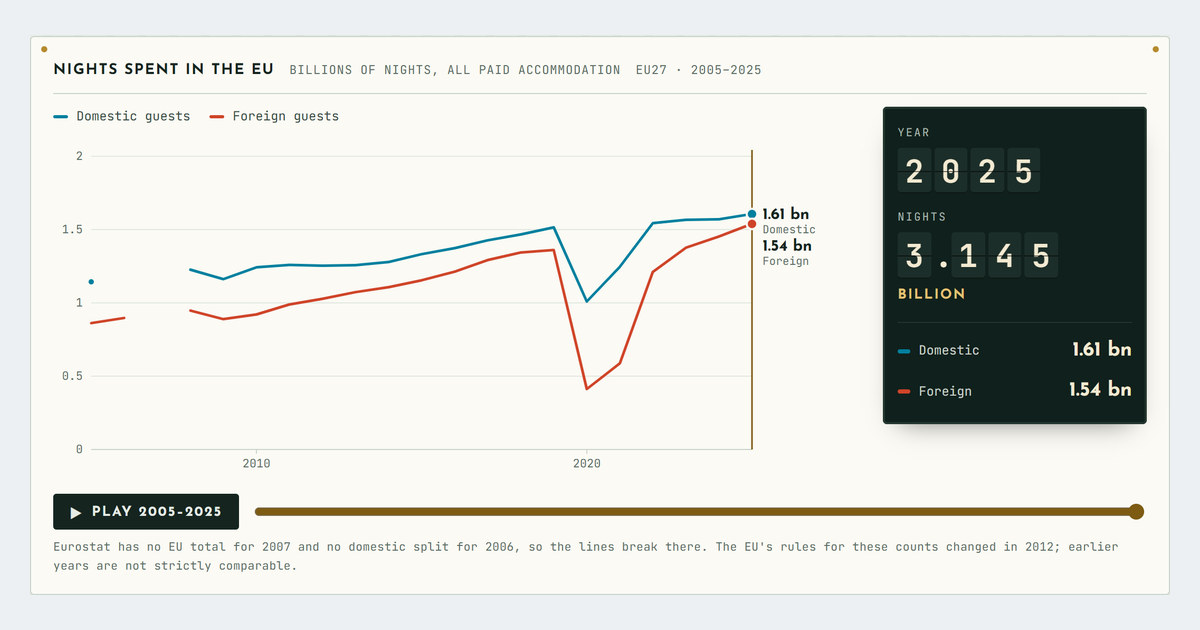
The EU spent a record 3.1 billion nights in hotels, holiday homes and campsites in 2025, almost half of them by foreign guests. Twenty years of who sleeps where, from Eurostat.
The EU spent a record 3.1 billion nights in tourist accommodation in 2025, up from 2.0 billion in 2005.
Read the story → -
Flight Path (AU)
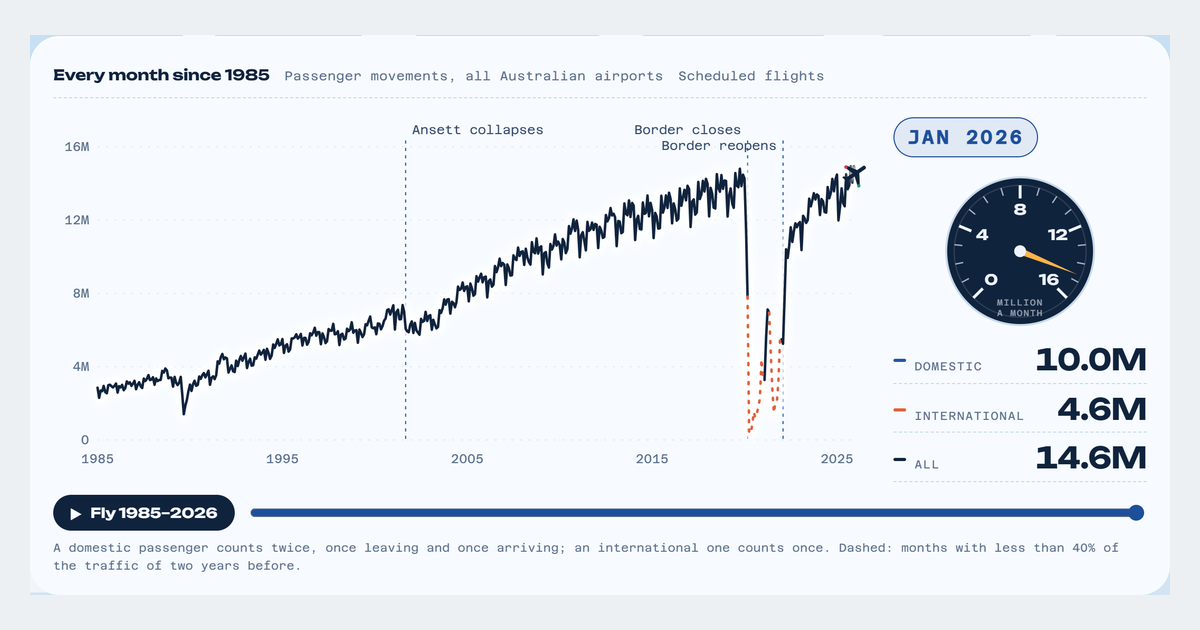
Forty years of Australian flying, from 33.4 million passenger movements in 1985 to 164.3 million in 2019, and the spring the sky emptied.
In April 2020, Australia's airports handled 360,694 passenger movements, 2.6% of April 2019.
Read the story → -
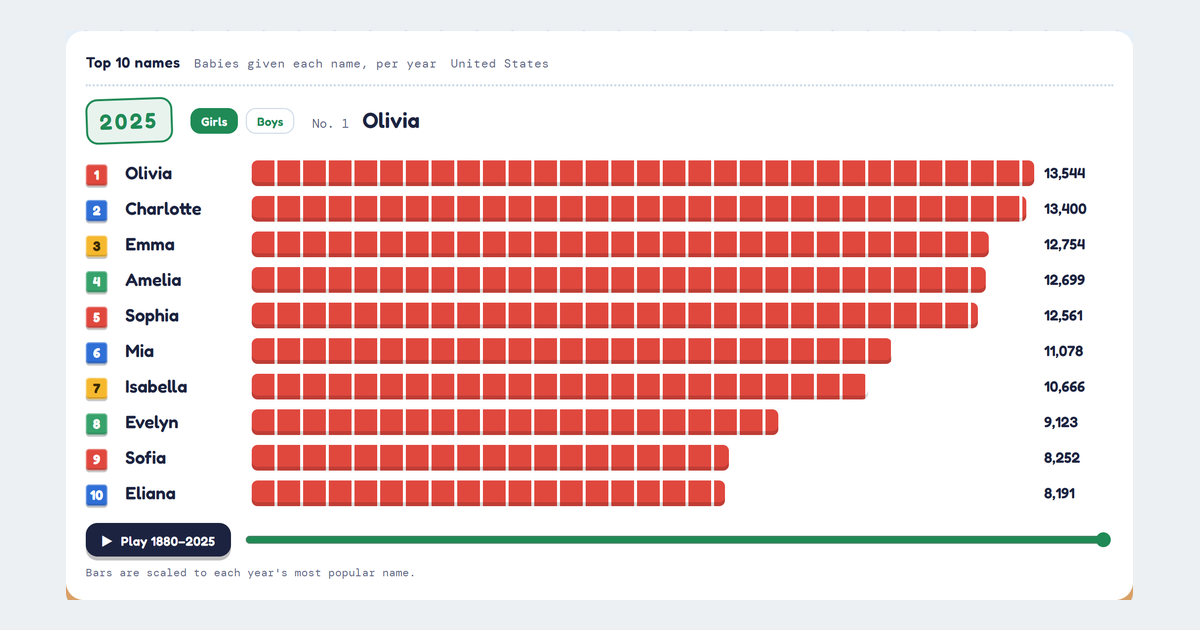
Name Tags (US)
146 years of American baby names, from Mary's long reign to the rise of Liam, told through Social Security records.
In 1947, 99,692 American girls were named Linda. In 2025, 294 were.
Read the story → -
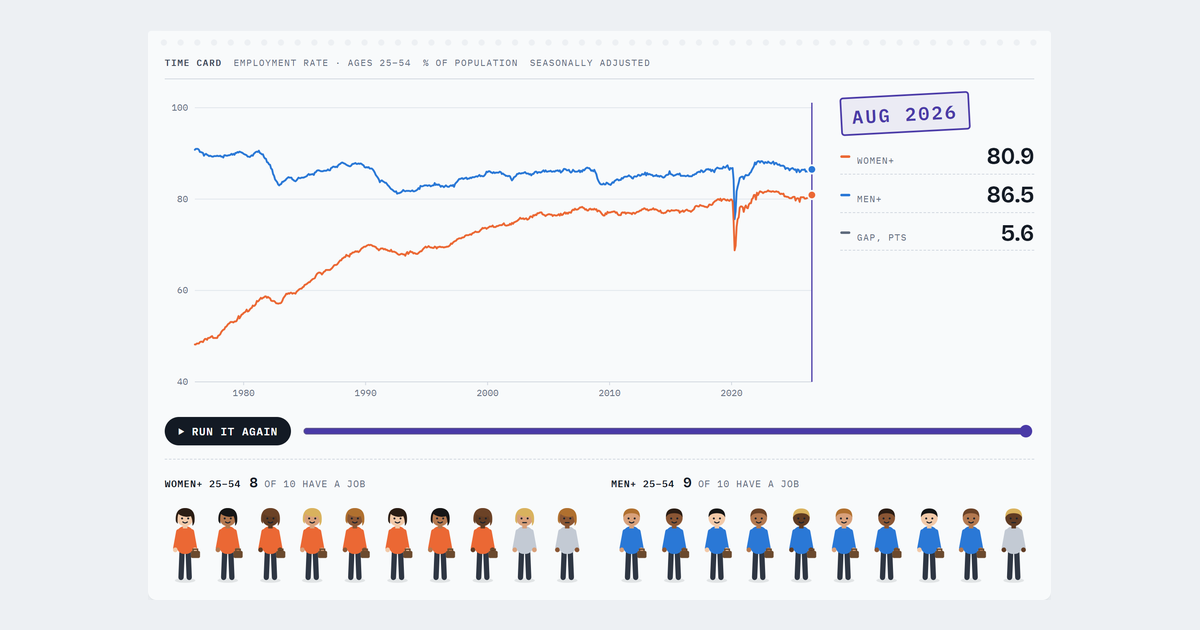
Clocking In (CA)
Fifty years of who works in Canada, and what they're paid, told through 608 monthly Labour Force Surveys.
In 1976, 48 of every 100 Canadian women aged 25 to 54 had a job. Today 81 do.
Read the story →
Get the next story in your inbox
One visual story from open data at a time. Free, no ads, no tracking. Unsubscribe with one click.
We'll email you a link to confirm. See our privacy notice.